
Sports
49ers vs Tampa Bay Buccaneers Match Player Stats: Complete Game Breakdown

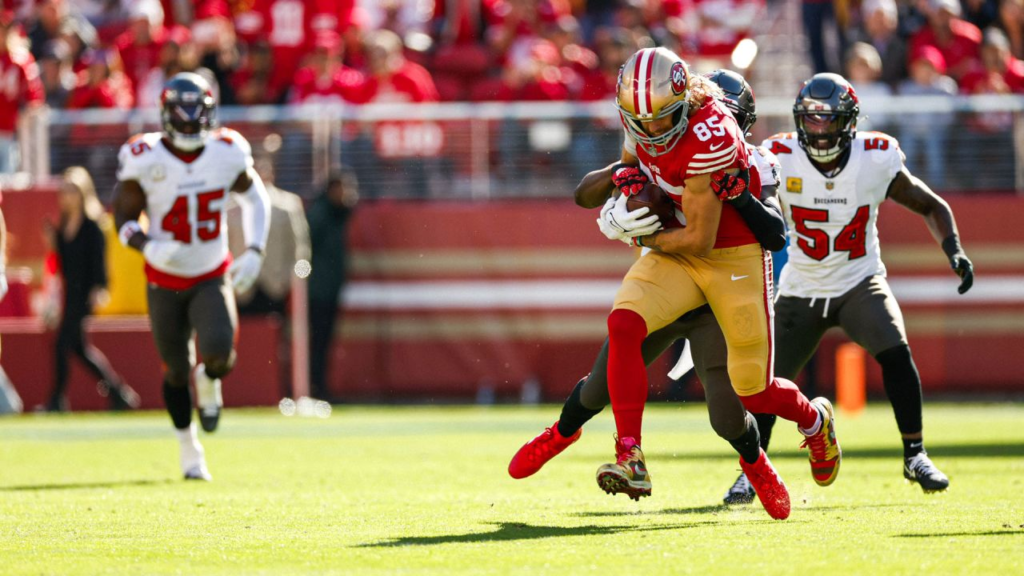
The 49ers vs Tampa Bay Buccaneers match player stats show one team that finished drives and another that stalled. Tampa Bay beat San Francisco 30-19 on October 12, 2025, at Raymond James Stadium. The 49ers won the yardage battle, 363 to 352, yet they lost the game. Mac Jones threw for 347 yards but gave the ball away twice. Baker Mayfield played an efficient game and avoided mistakes. This guide covers every key number from the most recent regular-season meeting between these teams. You will see who stood out, who struggled, and why the final score looked the way it did.
Score Table
| Team | 1st Quarter | 2nd Quarter | 3rd Quarter | 4th Quarter | Final |
|---|---|---|---|---|---|
| San Francisco 49ers | 3 | 13 | 3 | 0 | 19 |
| Tampa Bay Buccaneers | 7 | 13 | 7 | 3 | 30 |
Scoring Summary
| Quarter | Time | Team | Scoring Play | 49ers | Buccaneers |
|---|---|---|---|---|---|
| 1st | 9:54 | Buccaneers | Rachaad White 2-yard run (Chase McLaughlin kick) | 0 | 7 |
| 1st | 7:54 | 49ers | Eddy Piñeiro 52-yard field goal | 3 | 7 |
| 2nd | 10:18 | 49ers | Christian McCaffrey 1-yard run (Piñeiro kick) | 10 | 7 |
| 2nd | 5:10 | Buccaneers | Sean Tucker 9-yard run (McLaughlin kick) | 10 | 14 |
| 2nd | 2:05 | 49ers | Eddy Piñeiro 54-yard field goal | 13 | 14 |
| 2nd | 0:44 | Buccaneers | Kameron Johnson 34-yard pass from Baker Mayfield (2-point run failed) | 13 | 20 |
| 2nd | 0:02 | 49ers | Eddy Piñeiro 42-yard field goal | 16 | 20 |
| 3rd | 7:27 | 49ers | Eddy Piñeiro 29-yard field goal | 19 | 20 |
| 3rd | 2:40 | Buccaneers | Tez Johnson 45-yard pass from Baker Mayfield (McLaughlin kick) | 19 | 27 |
| 4th | 1:55 | Buccaneers | Chase McLaughlin 45-yard field goal | 19 | 30 |
Match Overview and Final Result
Tampa Bay won this Week 6 game 30-19 at home. The Buccaneers improved to 5-1, while San Francisco dropped to 4-2. The score looks comfortable, but the contest stayed close for three quarters. The 49ers trailed by only eight points entering the fourth quarter. Tampa Bay then added a field goal and shut the door. Fans expected a shootout, and the passing numbers gave San Francisco plenty of yardage. The Buccaneers simply played cleaner football when it mattered most. That edge shaped every player stat in this breakdown.
San Francisco started Mac Jones at quarterback, while Baker Mayfield led Tampa Bay. Both teams relied on their top running backs to set the tone. Christian McCaffrey carried the load for the 49ers. Rachaad White did the same for the Buccaneers. The two sides traded punches through the middle of the game. Each team scored 13 points in the second quarter. Tampa Bay then won the third quarter 7-3. That small gap proved decisive in the final result.
Quarter-by-Quarter Scoring Flow
Tampa Bay struck first and scored seven points in the opening quarter. San Francisco answered with a field goal and trailed 7-3. The second quarter then turned into a scoring race. Both teams put up 13 points, which kept the margin narrow. At halftime, the Buccaneers led 20-16. That pace suggested a high-scoring afternoon. Neither defense could slow the other offense for long. The crowd at Raymond James Stadium stayed loud as the lead held steady through the break.
The third quarter changed the game. Tampa Bay scored a touchdown, and San Francisco managed only a field goal. That swing pushed the lead to eight points at 27-19. The fourth quarter then belonged to the home team. The Buccaneers added a field goal, while the 49ers failed to score. San Francisco was shut out in the final period. That drought erased any comeback hope. Tampa Bay controlled the closing minutes and sealed a 30-19 victory.
Mac Jones Passing Performance
Mac Jones finished 27 of 39 for 347 yards. That works out to a 69.2 percent completion rate. He averaged 8.9 yards per attempt, which is a strong number. The volume was impressive, and he moved the ball through the air all afternoon. However, he did not throw a touchdown pass. He also threw two interceptions. Those turnovers erased much of the value from his yardage. For a quarterback who produced so many yards, the lack of scoring plays stands out as the biggest weakness.
Jones also added 13 rushing yards on five carries. His longest run covered five yards. He used his legs mostly to escape pressure and pick up small gains. The 49ers outgained Tampa Bay, but Jones could not turn that edge into points. Two interceptions gave the Buccaneers extra possessions and short fields. Great yardage totals mean little without touchdowns. This game shows how turnovers can undo even a 300-yard passing day. Jones moved the offense, but he could not finish drives.
Baker Mayfield Passing Performance
Baker Mayfield delivered a sharp, efficient game. He completed 17 of 23 passes for 256 yards. That equals a 73.9 percent completion rate. He averaged 11.1 yards per attempt, far above his opponent. Mayfield threw two touchdown passes and no interceptions. His clean stat line gave Tampa Bay the edge. He threw fewer passes than Jones but made each one count. The Buccaneers did not need volume from their quarterback. They needed precision, and Mayfield supplied it on nearly every throw he attempted.
Mayfield also used his legs. He rushed three times for 14 yards, and his longest run went 15 yards. That mobility kept the 49ers defense honest. His touchdown passes went to K. Johnson and T. Johnson. The second score covered 45 yards and came on a single catch. Big plays like that changed the game. Mayfield protected the football and found open receivers downfield. His performance showed how smart decisions can beat raw yardage. He earned the quarterback win by avoiding mistakes.
Rushing Stats for Both Teams
Rachaad White led all rushers with 65 yards on 17 carries. He averaged 3.8 yards per attempt and scored a touchdown. His longest run went 10 yards. Sean Tucker added 25 yards on six carries, an average of 4.2. He also found the end zone. Mayfield contributed 14 yards on three runs. As a team, Tampa Bay rushed 26 times for 104 yards. That steady production kept the clock moving. It also kept the 49ers defense on the field for long stretches.
Christian McCaffrey carried 17 times for 54 yards and one touchdown. He averaged just 3.2 yards per carry. His longest run covered 11 yards. Jones added 13 yards on five carries. San Francisco totaled 22 rushes for 67 yards, a 3.0 average. The Buccaneers defense limited big plays on the ground. McCaffrey did more damage as a receiver, where he led the team in catches. The 49ers never found a rhythm running the ball. That forced them to lean heavily on the pass.
49ers Receiving Leaders
Kendrick Bourne led San Francisco with five catches for 142 yards. His longest reception covered 56 yards, the biggest play of the day for the 49ers. Jake Tonges followed with six catches for 58 yards. Christian McCaffrey caught seven passes for 57 yards, the most receptions on the team. DeMarcus Robinson added two catches for 44 yards, including a 31-yard gain. These four players produced most of the passing yardage. The 49ers spread the ball around well, and no single target dominated the game plan.
The supporting cast also contributed. Marquez Valdes-Scantling caught two passes for 22 yards. Kyle Juszczyk added one catch for nine yards. B. Robinson caught three passes for eight yards. Jauan Jennings had one catch for seven yards. In total, the 49ers completed 27 passes for 347 yards. Not one of those catches ended in the end zone. That fact explains why the offense produced yardage without matching points. San Francisco moved the ball between the twenties but lacked a finishing touch near goal.
Buccaneers Receiving Leaders
K. Johnson led Tampa Bay with four catches for 64 yards and a touchdown. His longest grab covered 34 yards. Cade Otton caught five passes for 51 yards, and his longest went 23 yards. Sterling Shepard made two catches for 51 yards, including a 36-yard play. T. Johnson had only one reception, but it went 45 yards for a touchdown. That single play showed how quickly the Buccaneers could strike. Mayfield found different targets all game, which made the passing attack hard to defend.
Emeka Egbuka added two catches for 24 yards, with a long of 17. Rachaad White also contributed as a receiver. He caught three passes for 21 yards. Tampa Bay completed 17 passes for 256 yards in total. That means each catch averaged about 15 yards. The Buccaneers did not need many receptions to move the ball. They hit big plays and finished drives with touchdowns. That efficiency mattered more than raw volume. It also explains why Tampa Bay won despite fewer total yards.
Team Statistics and Turning Points
San Francisco gained 363 net yards, while Tampa Bay gained 352. The 49ers also held the ball longer, with 32:35 of possession against 27:25. Those numbers usually favor the winner, but not here. San Francisco also committed nine penalties for 65 yards. Tampa Bay committed only five for 31 yards. Those extra flags hurt the 49ers and stalled several drives. The Buccaneers played a more disciplined game. Small details like penalties often decide close contests, and this match proved that again.
Two turning points stand out. First, Jones threw two interceptions, while Mayfield threw none. That turnover gap gave Tampa Bay extra chances. Second, the Buccaneers hit explosive plays, including a 45-yard touchdown reception. San Francisco had no passing touchdowns despite 347 yards through the air. Efficiency beat volume in this game. The Buccaneers scored on their chances and protected the football. The 49ers moved the ball but could not convert yards into points. That difference defined the match player stats and the final scoreboard.
Conclusion
The 49ers vs Tampa Bay Buccaneers match player stats reveal a game decided by efficiency, not yardage. Baker Mayfield threw two touchdowns without an interception. Mac Jones passed for 347 yards but threw two picks and no scores. Rachaad White and Christian McCaffrey both found the end zone on the ground. Kendrick Bourne gave San Francisco its biggest receiving day, while K. Johnson and T. Johnson delivered key touchdowns for Tampa Bay. The Buccaneers won 30-19 and moved to 5-1. Check back for updated stats as both teams continue their seasons.
Frequently Asked Questions
Who won the 49ers vs Tampa Bay Buccaneers game?
The Tampa Bay Buccaneers won 30-19 on October 12, 2025, at Raymond James Stadium. The victory improved Tampa Bay to 5-1 and dropped San Francisco to 4-2.
Who had the most passing yards in the game?
Mac Jones led all passers with 347 yards on 27 of 39 attempts for the 49ers. He threw two interceptions and no touchdowns. Baker Mayfield passed for 256 yards and two touchdowns.
Who led the game in rushing yards?
Rachaad White led all rushers with 65 yards on 17 carries and scored a touchdown. Christian McCaffrey ran for 54 yards and one score for San Francisco.
Which receiver had the most yards?
Kendrick Bourne had the biggest receiving day with five catches for 142 yards. His longest catch covered 56 yards.
Did the 49ers outgain the Buccaneers?
Yes, the 49ers gained 363 net yards to Tampa Bay’s 352. They also held the ball longer. Turnovers and penalties kept them from turning that edge into a win.

The New York Knicks and LA Clippers met at Intuit Dome on March 9, 2026, and the Clippers won 126-118. This New York Knicks vs LA Clippers match player stats breakdown covers the numbers that mattered. You will see who scored, who rebounded, and who ran the offense. Karl-Anthony Towns posted a huge night in defeat, while Kawhi Leonard and Bennedict Mathurin led Los Angeles. Read on for the full story behind the box score.
Score Table
| Team | 1st Quarter | 2nd Quarter | 3rd Quarter | 4th Quarter | Final Score |
|---|---|---|---|---|---|
| New York Knicks | 24 | 31 | 26 | 37 | 118 |
| LA Clippers | 28 | 36 | 24 | 38 | 126 |
Scoring Summary
| Quarter | Quarter Winner | Quarter Margin | Running Score (Knicks-Clippers) | Lead After Quarter |
|---|---|---|---|---|
| 1st Quarter | Clippers | +4 | 24-28 | Clippers by 4 |
| 2nd Quarter | Clippers | +5 | 55-64 | Clippers by 9 |
| 3rd Quarter | Knicks | +2 | 81-88 | Clippers by 7 |
| 4th Quarter | Clippers | +1 | 118-126 | Clippers by 8 |
Match Overview and Quarter Flow
The Clippers beat the Knicks 126-118 in Inglewood. Los Angeles climbed back to .500 for the first time since early November. The Knicks left with a 41-25 record, while the Clippers moved to 32-32. Los Angeles led after every quarter. New York won only the third quarter, 26-24.
The Clippers built their cushion early. They scored 28 in the first quarter and 36 in the second, which gave them a 64-55 halftime lead. The Knicks cut the gap only slightly after the break. New York scored 37 in the fourth quarter, but the Clippers answered with 38 and protected the win.
Karl-Anthony Towns Leads the Knicks Scoring
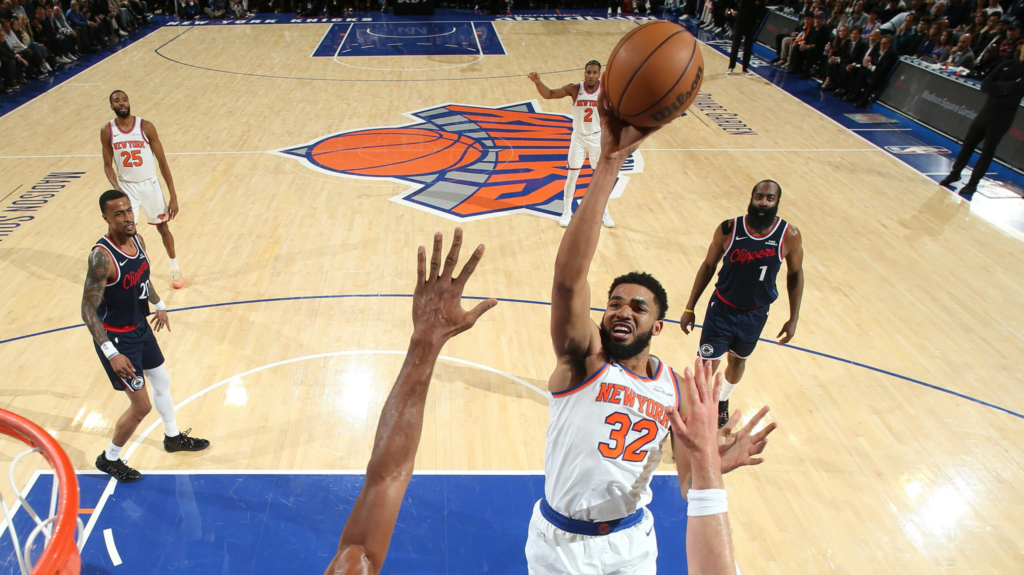
Karl-Anthony Towns delivered the best individual stat line of the night. He scored 35 points on 13-of-17 shooting and hit three of his four three-point attempts. He also grabbed 12 rebounds and handed out seven assists in about 36 minutes. Those numbers sit well above his season averages of 20.0 points and 11.9 rebounds per game.
Towns also went 6-of-8 at the free-throw line, which boosted his efficiency. However, foul trouble ended his night. He fouled out in the final seconds with six personal fouls. The Knicks were outscored by 12 points while he played, so his big night did not carry the team. Great numbers still could not secure the win.
Jalen Brunson and OG Anunoby Support the Attack
Jalen Brunson added 28 points on 12-of-23 shooting. He also dished out eight assists and grabbed four rebounds across 38 minutes. His three-point shot cooled, as he made two of seven attempts. Brunson committed three turnovers, a small blemish on a steady game. He finished with a plus-one rating, the best mark among the Knicks starters.
OG Anunoby supported the scoring with 22 points on 8-of-15 shooting. He hit three of eight from deep and made three of four free throws. Anunoby also collected six rebounds, two assists and two steals. His four turnovers hurt, though, and he finished minus three. Together, Brunson and Anunoby gave the Knicks 50 points.
Josh Hart Dominates the Glass
Josh Hart controlled the boards for New York. He grabbed 13 rebounds, the highest total in the game, and seven came on the offensive end. Hart also scored 12 points on 5-of-7 shooting and added three assists. He played about 36 minutes and committed three turnovers. Those extra rebounds gave the Knicks second chances throughout the night.
Hart’s rebounding stood out even more beside his teammates. Mikal Bridges followed with seven boards, and Towns added 12. Yet the Knicks still finished minus 13 with Hart on the court. He also picked up four fouls. His effort on the glass was the clearest hustle stat of the night, even though the final score went against him.
Kawhi Leonard Controls the Clippers Offense
Kawhi Leonard led the Clippers with 29 points. He grabbed seven rebounds and dished out eight assists, which matched Jalen Brunson for the game high. Leonard entered the night averaging 27.9 points per game, so his scoring matched his usual level. His playmaking added another layer, since eight assists showed how often he found open teammates.
Leonard’s all-around game gave the Clippers a steady anchor whenever the Knicks pushed. He did not need a record shooting night to shape the pace. His balanced line of points, rebounds and assists made him the most complete player on the floor for Los Angeles. Few players in this game affected the result in as many ways.
Bennedict Mathurin and Darius Garland Power the Clippers
Bennedict Mathurin delivered the biggest surprise of the night. He came off the bench and scored 28 points, and 22 of them arrived in the second half. That surge gave the Clippers a second scoring engine beside Leonard. His second-half burst helped Los Angeles hold off the Knicks’ fourth-quarter charge.
Darius Garland also played a major role in his second start for the Clippers. He scored 23 points and added seven assists. Five Clippers reached double figures, which showed how balanced the attack was. That depth forced the Knicks to defend more than one scorer. It also explains why Los Angeles kept pace in a high-scoring game.
Clippers Bench and Defensive Contributions
The Clippers also won through defense and energy. Kris Dunn led all players with three steals, and those takeaways sparked easy chances. Derrick Jones Jr. led the game with two blocks. Their activity gave Los Angeles an edge in details that never show up in the scoring column.
Bench production mattered as well. Mathurin gave the reserves a huge boost, and the second unit kept the pace high. The Clippers did not rely on one star. Leonard, Mathurin and Garland each scored at least 23 points, and the supporting cast filled the gaps. That balance made Los Angeles harder to stop than New York.
Knicks Bench and Shooting Struggles
The New York bench struggled to match that impact. Landry Shamet scored nine points but shot just 3-of-12, and every attempt came from three-point range. Mamadi Diawara added five points, four rebounds and two assists. Ariel Hukporti grabbed three rebounds without scoring, and Jose Alvarado missed all four of his shots.
Mikal Bridges also had a quiet night. He scored seven points on 3-of-8 shooting, grabbed seven rebounds, and added four assists and two steals. Yet New York was outscored by 17 points while he played, the worst mark among the Knicks’ main rotation. Cold bench shooting left the Knicks short, and that explains much of the eight-point loss.
Conclusion
The Knicks vs Clippers match player stats tell a clear story. Towns put up 35 points and 12 rebounds, but Leonard, Mathurin and Garland gave the Clippers more scoring balance. Hart’s rebounding and Brunson’s playmaking kept New York close. Los Angeles won the small details and the bench battle. Fans who want more recaps and player stats can follow the next game.
Frequently Asked Questions
Who won the Knicks vs Clippers game?
The Clippers won 126-118 at Intuit Dome on March 9, 2026.
Who scored the most points in the game?
Karl-Anthony Towns led all players with 35 points on 13-of-17 shooting.
Who led the Clippers in scoring?
Kawhi Leonard scored 29 points, while Bennedict Mathurin added 28 off the bench.
Who had the most rebounds?
Josh Hart led both teams with 13 rebounds, including seven offensive boards.
Did Karl-Anthony Towns foul out?
Yes. Towns fouled out in the final seconds after picking up six personal fouls.
Denver Nuggets vs Oklahoma City Thunder match player stats reveal how a tense overtime game unfolded on February 27, 2026. The Thunder beat the Nuggets 127-121 at Paycom Center. Jamal Murray scored 39 points for Denver, and Shai Gilgeous-Alexander answered with 36. Nikola Jokić recorded a triple-double in the loss. This full box score breakdown covers every key performer, the bench, team shooting, and the overtime stretch.
Score Table
| Team | First Quarter | Second Quarter | Third Quarter | Fourth Quarter | Overtime | Final |
|---|---|---|---|---|---|---|
| Denver Nuggets | 33 | 26 | 24 | 24 | 14 | 121 |
| Oklahoma City Thunder | 19 | 31 | 27 | 30 | 20 | 127 |
Scoring Summary
| Period | Score After Period | Top Scorers |
|---|---|---|
| First Quarter | Nuggets 33, Thunder 19 | Christian Braun 10 (DEN), Shai Gilgeous-Alexander 8 (OKC) |
| Second Quarter | Nuggets 59, Thunder 50 | Gilgeous-Alexander 10 (OKC), Bruce Brown 7 (DEN) |
| Third Quarter | Nuggets 83, Thunder 77 | Jamal Murray 14 (DEN), Gilgeous-Alexander 14 (OKC) |
| Fourth Quarter | Tied 107-107 | Jared McCain 8 (OKC), Murray 7 (DEN) |
| Overtime | Thunder 127, Nuggets 121 | Murray 10 (DEN), Cason Wallace 6 and Isaiah Joe 6 (OKC) |
Match Overview and Final Result
The Thunder hosted the Nuggets on February 27, 2026, in front of 18,203 fans at Paycom Center. Denver started fast and led 33-19 after the first quarter. The Nuggets still held a 59-50 edge at halftime. Oklahoma City then outscored Denver 57-48 in the second half and forced overtime at 107-107. Both teams missed key rotation players. Aaron Gordon and Peyton Watson sat out for Denver. Jalen Williams and Ajay Mitchell missed the game for Oklahoma City. Even so, the box score still produced plenty of star power.
Overtime belonged to the Thunder. Oklahoma City outscored Denver 20-14 in the extra period and made all ten of its free throws. The win lifted the Thunder to 46-15 on the season, while the Nuggets dropped to 37-23. The box score shows a close contest in almost every category. Oklahoma City shot better from the field and earned more trips to the line. The Thunder also turned the ball over far less often. Those small edges decided a game that stayed tight until the end.
Jamal Murray Carries Denver in Regulation and Overtime
Jamal Murray gave Denver everything it needed on offense. He played 47 minutes and finished with 39 points on 12-of-26 shooting. Murray made seven of his 13 three-point attempts and hit eight of ten free throws. He also grabbed eight rebounds, handed out six assists, and recorded two steals. His third quarter stood out, with 14 points on five-of-six shooting. That burst kept Denver in front after Oklahoma City trimmed the early lead. He also shot 54 percent from three-point range, which kept Denver’s offense dangerous.
Murray refused to let the Nuggets fade in overtime. He scored ten of Denver’s 14 points in the extra period and drained three more three-pointers. Unfortunately for Denver, the rest of the lineup went cold. Murray also picked up four of his five fouls in those five minutes. His plus-minus of plus five shows how close the game stayed with him on the floor. He carried the heaviest scoring load on either side. His shot-making kept the Nuggets within reach until the final buzzer.
Nikola Jokić Controls the Game Without Efficient Shooting
Nikola Jokić delivered a triple-double with 23 points, 17 rebounds, and 14 assists in nearly 45 minutes. His passing again set the tone for Denver’s offense. He finished with a team-high plus-minus of plus 15, even though the Nuggets lost. Shooting was the one weak spot in his night. Jokić made nine of 25 field goals and only two of ten from three-point range. He also committed three turnovers, which fit the pace of a physical, grinding game. Few stars can shoot that poorly and still lead their team.
Jokić controlled the glass from the opening quarter, where he collected nine rebounds alone. He added nine assists in the second half as Denver searched for clean looks. The overtime period did not go his way, though. Jokić missed three of his four shots and scored just two points. Still, his rebounding and playmaking kept Denver’s offense organized for most of the night. Few players can lose an efficiency battle and still shape a game this heavily. His 15 defensive rebounds also helped Denver limit Oklahoma City’s second chances.
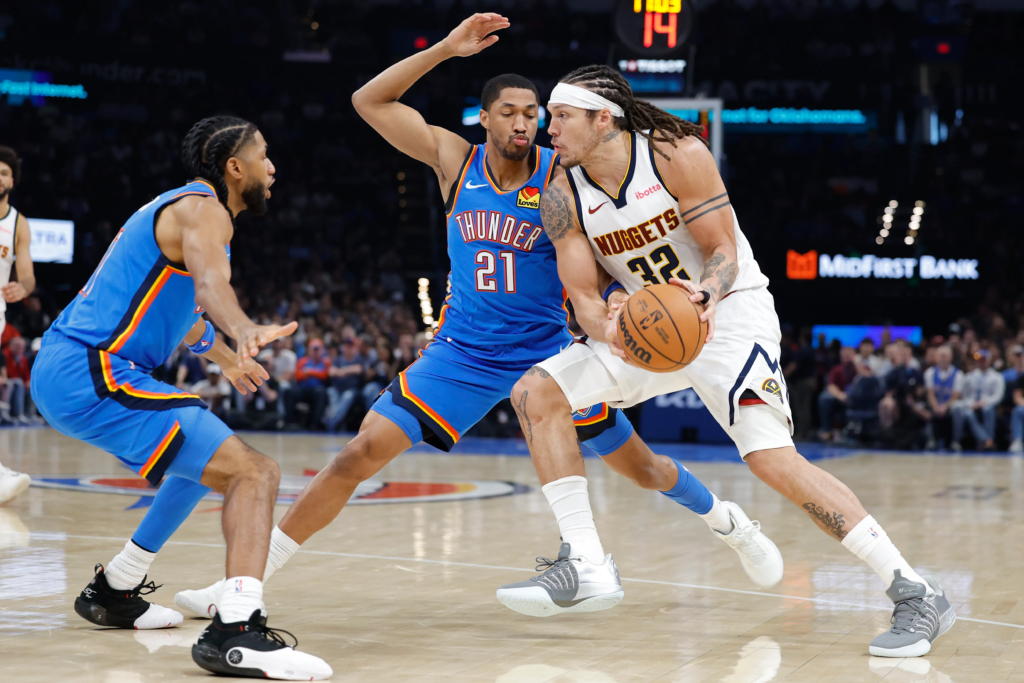
Shai Gilgeous-Alexander Delivers Free Throw Pressure
Shai Gilgeous-Alexander led Oklahoma City with 36 points in under 34 minutes. He made 12 of 29 field goals and went 12-of-13 at the free throw line. He also dished out nine assists, grabbed three rebounds, and added two steals and two blocks. Gilgeous-Alexander turned the ball over only once. His scoring split evenly, with 18 points in each halfhttps://en.wikipedia.org/wiki/Kris_Dunn. He finished with a plus-minus of plus 16, which shows how much Oklahoma City gained when he played. His all-around line kept the Thunder steady during Denver’s early push.
His night came from attacking the rim, not from long range. Gilgeous-Alexander missed all three of his three-point attempts and relied on drives and foul shots. He scored 14 points in the third quarter, including six free throws, to erase Denver’s halftime lead. His fourth quarter cooled off, as he made just one of six shots. The box score lists no overtime minutes for him. His teammates finished the job in the extra period and sealed the win for Oklahoma City.
Chet Holmgren Wins the Rebounding Battle
Chet Holmgren posted one of the most dominant rebounding lines of the night. He pulled down 21 rebounds, including 19 on the defensive end. He also scored 15 points on five-of-eight shooting and made four of six free throws. Holmgren added three assists, three blocks, and a steal in 38 minutes. He committed no fouls. His rebound share topped 27 percent. His efficiency ranked among the best on the floor, with a true shooting mark above 70 percent.
Holmgren protected the rim and ended many Denver possessions after a single shot. His defensive rebounding gave Oklahoma City extra transition chances. In overtime, he added four points on perfect free throw shooting and grabbed three more rebounds. Isaiah Hartenstein supported him with nine points, eight rebounds, five assists, two steals, and two blocks in 25 minutes. Together, the two big men limited Denver’s second chances. They helped Oklahoma City win the rebounding battle 56-51 and control the paint.
Bench Production and Supporting Cast
Oklahoma City’s reserves delivered the depth that decided this game. Jared McCain scored 14 points on six-of-eight shooting in just 19 minutes. Jaylin Williams added 12 points and posted a team-best plus-minus of plus 17. Alex Caruso scored 12 points, and Isaiah Joe added nine on three-of-five three-point shooting. Joe hit two three-pointers in overtime. Cason Wallace, a starter, also contributed ten points, including six in the extra period. Aaron Wiggins struggled with one-of-seven shooting, but the depth covered his misses.
Denver’s supporting cast gave solid effort but could not match that depth. Christian Braun scored 23 points and grabbed eight rebounds as a starter. Tim Hardaway Jr. came off the bench for 16 points and made four of seven three-pointers. Bruce Brown added seven points and three steals. Cameron Johnson collected eight rebounds and three blocks but finished with a minus 25 rating. Julian Strawther went scoreless in 15 minutes. Jonas Valančiūnas scored six points in just eight minutes of work.
Team Shooting and Overtime Turning Point
The team numbers show a game decided by small margins. Oklahoma City shot 46.5 percent from the field, compared with 41.7 percent for Denver. The Nuggets attempted 48 three-pointers and made 18, while the Thunder made 12 of 35. Oklahoma City also won the rebounding battle and handed out 29 assists to Denver’s 27. The Nuggets turned the ball over 18 times. The Thunder gave it away only 12 times, and that gap gave them extra shots.
Free throws and fouls tipped the balance. Oklahoma City made 23 of 27 free throws, and Denver made 17 of 22. The Nuggets committed 22 fouls to the Thunder’s 16. In overtime, Oklahoma City shot four-of-seven from the field and went ten-of-ten at the line. Denver shot five-of-14 and turned the ball over three times. The Thunder also finished with 14 steals and ten blocks. That pressure disrupted Denver’s offense throughout the night.
Conclusion
The Denver Nuggets vs Oklahoma City Thunder match player stats show a game of star performances and tiny margins. Murray and Jokić kept Denver competitive with huge numbers, while Gilgeous-Alexander and Holmgren anchored the Thunder. Oklahoma City’s bench, free throw shooting, and ball security gave it the edge in overtime. The Thunder earned a 127-121 win and moved to 46-15. Fans can expect more drama when these two Western Conference rivals meet again.
Frequently Asked Questions
Who won the Denver Nuggets vs Oklahoma City Thunder game?
The Oklahoma City Thunder won 127-121 in overtime on February 27, 2026. The teams tied at 107-107 after regulation, and the Thunder outscored Denver 20-14 in the extra period.
Who scored the most points in the game?
Jamal Murray led all scorers with 39 points for the Nuggets. Shai Gilgeous-Alexander followed with 36 points for the Thunder, and Christian Braun added 23 for Denver.
Did Nikola Jokić record a triple-double?
Yes. Jokić finished with 23 points, 17 rebounds, and 14 assists. He shot nine of 25 from the field, and Denver still lost in overtime.
Which player grabbed the most rebounds?
Chet Holmgren led the game with 21 rebounds, including 19 defensive boards. Jokić ranked second with 17 rebounds for the Nuggets.
When do the Nuggets and Thunder play next?
The next scheduled meeting tips off at 01:30 UTC on October 23, 2026. That is the evening of October 22 in Oklahoma City. Check the official NBA schedule for changes.
The Carolina Panthers vs Arizona Cardinals match delivered a wild finish at State Farm Stadium. Arizona built a huge early lead and then held on for a 27-22 win. Bryce Young threw for 328 yards and three touchdowns during a late rally. Calais Campbell ended the comeback with a sack. This breakdown covers every key player stat, scoring play, and turning point.
Score Table
| Team | 1st Quarter | 2nd Quarter | 3rd Quarter | 4th Quarter | Final |
|---|---|---|---|---|---|
| Carolina Panthers | 3 | 0 | 6 | 13 | 22 |
| Arizona Cardinals | 10 | 10 | 7 | 0 | 27 |
Scoring Summary
| Quarter | Time | Team | Scoring Play | Panthers | Cardinals |
|---|---|---|---|---|---|
| 1st | 13:36 | Cardinals | Zaven Collins 3-yard fumble return (Chad Ryland kick) | 0 | 7 |
| 1st | 5:22 | Cardinals | Chad Ryland 29-yard field goal | 0 | 10 |
| 1st | 0:53 | Panthers | Ryan Fitzgerald 27-yard field goal | 3 | 10 |
| 2nd | 2:00 | Cardinals | Chad Ryland 47-yard field goal | 3 | 13 |
| 2nd | 0:04 | Cardinals | Michael Wilson 11-yard pass from Kyler Murray (Chad Ryland kick) | 3 | 20 |
| 3rd | 9:23 | Cardinals | James Conner 2-yard run (Chad Ryland kick) | 3 | 27 |
| 3rd | 2:06 | Panthers | Hunter Renfrow 4-yard pass from Bryce Young (two-point try failed) | 9 | 27 |
| 4th | 5:05 | Panthers | Chuba Hubbard 5-yard pass from Bryce Young (two-point try failed) | 15 | 27 |
| 4th | 1:58 | Panthers | Hunter Renfrow 1-yard pass from Bryce Young (Ryan Fitzgerald kick) | 22 | 2 |
Match Overview and Final Result
The Cardinals beat the Panthers 27-22 on Sunday, September 14, 2025, in Glendale, Arizona. Arizona improved to 2-0, while Carolina fell to 0-2. CBS carried the game nationally. The Panthers had won seven of the previous eight meetings, but that history did not help them here.
The final score hides how close the game became. Arizona led 27-3 early in the third quarter. Carolina then scored three touchdowns and got the ball back in the final minutes. The Cardinals survived because their defense made one more big play when the game demanded it.
Game Flow From Start to Finish
Arizona struck first when Josh Sweat forced a Young fumble and Zaven Collins returned it three yards for a touchdown. Chad Ryland added a 29-yard field goal. Ryan Fitzgerald answered for Carolina from 27 yards. Ryland then kicked a 47-yarder, and Michael Wilson caught an 11-yard touchdown from Kyler Murray just before halftime.
James Conner stretched the lead with a two-yard run early in the third quarter. Carolina then came alive. Young found Hunter Renfrow from four yards, Chuba Hubbard from five yards, and Renfrow again from one yard. Two failed two-point tries left the Panthers five points short.
Bryce Young Passing Performance
Bryce Young completed 35 of 55 passes for 328 yards, three touchdowns, and one interception. He took three sacks and lost a fumble. Those early mistakes dug a deep hole for Carolina. His average of 6.0 yards per attempt showed a short, high-volume passing plan.
The second half belonged to Young. He threw all three touchdown passes after halftime. He also converted a fourth-and-16 with a 26-yard throw to Brycen Tremayne. That conversion helped set up the final touchdown and showed real poise under pressure.
Kyler Murray Passing and Rushing Performance
Kyler Murray went 17 of 25 for 220 yards, one touchdown, and one interception. He averaged 8.8 yards per attempt, which gave Arizona a clear efficiency edge. His touchdown pass to Wilson came with four seconds left in the first half. It pushed the lead to 20-3.
Murray also hurt Carolina with his legs. He ran seven times for 32 yards, including a spectacular 30-yard scramble in the fourth quarter. His interception came while a defender hit him mid-throw. Carolina answered with a long touchdown drive.
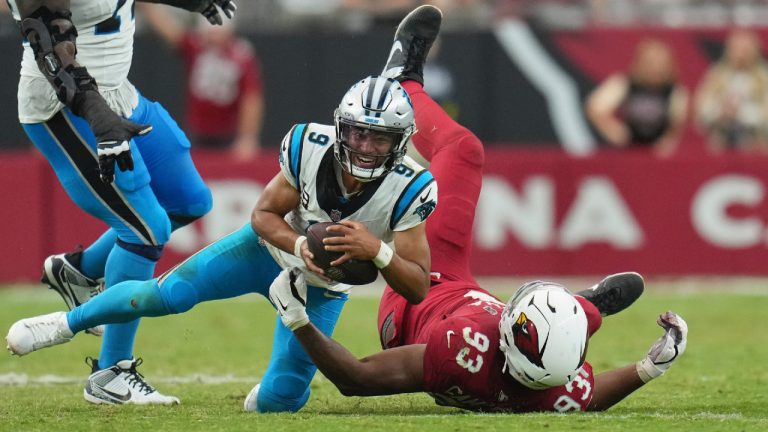
Panthers Rushing and Receiving Leaders
Chuba Hubbard led Carolina on the ground with 10 carries for 38 yards. He also caught five passes for 39 yards and a touchdown. Rico Dowdle added six carries for nine yards. As a team, the Panthers ran 19 times for just 49 yards, so the passing game carried the offense.
Rookie Tetairoa McMillan topped the receivers with six catches for 100 yards, including a 40-yard gain. Ja’Tavion Sanders caught seven passes for 54 yards. Renfrow also had seven catches for 48 yards and two touchdowns. Xavier Legette saw eight targets but finished with one catch for minus two yards.
Cardinals Rushing and Receiving Leaders
James Conner carried 11 times for 34 yards and a touchdown. He also caught a pass for 18 yards. Trey Benson added 14 rushing yards and four catches for 30 yards. As a team, Arizona ran 22 times for 82 yards, and Murray supplied 32 of them.
Trey McBride led Arizona’s receivers with six catches for 78 yards, including a 31-yarder. Elijah Higgins turned two catches into 45 yards, highlighted by a 27-yard gain. Marvin Harrison Jr. caught two passes for 27 yards. Wilson finished with one catch, but it went for a touchdown.
Defensive Standouts and Sack Leaders
Calais Campbell made the biggest defensive play of the day. The 39-year-old tackle finished with two sacks, including the game-ending sack with 26 seconds left. Josh Sweat delivered the strip-sack that set up Collins’s touchdown. Those two plays gave Arizona its sharpest edge.
Carolina’s defense also showed up. Safety Tre’von Moehrig led all tacklers with nine stops, seven of them solo. DJ Wonnum made four tackles, intercepted Murray, and broke up a pass. Princely Umanmielen added a sack, and Carolina held Arizona to 293 total yards.
Turnovers, Penalties and Team Statistics
Carolina outgained Arizona 352 yards to 293 and held the ball for 33 minutes and 15 seconds. Those numbers show how much the Panthers controlled the second half. Yet turnovers decided the first half. Carolina lost two, while Arizona lost one.
Penalties also hurt. Arizona committed 12 for 96 yards, while Carolina had seven for 83 yards. The biggest flag was a 38-yard pass interference call on Carolina. It set up Arizona deep in Panthers territory and led to a field goal.
Special Teams and Scoring Summary
Chad Ryland made field goals from 29 and 47 yards and kicked three extra points. That gave Arizona nine kicking points. Fitzgerald hit a 27-yard field goal for Carolina and added the final extra point. Both kickers stayed steady in a game full of swings.
Trevor Etienne returned four kickoffs for 89 yards, with a long of 35. Dowdle added a 24-yard return, and Greg Dortch returned one 25 yards for Arizona. Carolina also recovered an onside kick late, which gave Young one final chance.
Key Turning Points of the Game
Three plays shaped the result. Sweat’s strip-sack and Collins’s touchdown flipped the tone early. Wilson’s touchdown just before halftime then turned a ten-point game into a 17-point lead. That cushion proved large enough to survive Carolina’s rally.
Carolina’s comeback was the next big swing. The Panthers recovered the onside kick, yet Campbell sacked Young on fourth down. That stop ended the threat and protected Arizona’s 2-0 start. One defensive play decided a game that stayed tense until the final seconds.
Conclusion
The Carolina Panthers vs Arizona Cardinals match offered big stats and a dramatic ending. Young filled the box score, Murray played efficiently, and Campbell closed the game. Arizona’s early defensive touchdown and halftime lead proved decisive. Carolina showed real fight but could not erase the early gap.
Frequently Asked Questions
Who won the Carolina Panthers vs Arizona Cardinals game?
The Arizona Cardinals won 27-22 at State Farm Stadium on September 14, 2025. The win moved Arizona to 2-0 on the season.
Which player had the most passing yards?
Bryce Young led all passers with 328 yards on 35 of 55 passing. Kyler Murray threw for 220 yards.
Who led the Cardinals in rushing yards?
James Conner led Arizona with 34 rushing yards and a touchdown on 11 carries. Murray added 32 yards on seven runs.
Who made the game-ending play?
Calais Campbell sacked Bryce Young on fourth down with 26 seconds left. That play ended Carolina’s comeback attempt.
How many touchdowns did Hunter Renfrow score?
Renfrow scored two touchdowns, from four yards and from one yard. He finished with seven catches for 48 yards.


Samantha Speno: The Life Story of Randy Orton’s First Wife

Who Is Danna Lynn Blocker? Meet Dan Blocker’s Daughter

Who Is Amy Sherrill? What We Know About Tim Duncan’s Ex-Wife

Pinoroduct Com: A Simple Guide for First-Time Visitors (2026)

Who Is Eric Ritchson? The Quiet Older Brother of Actor Alan Ritchson

Who Is Ramtin Abdo? The Quiet Life of Kate Scott’s Ex-Husband
-
 Technology2 months ago
Pinoroduct Com: A Simple Guide for First-Time Visitors (2026)
-
 Celebrity2 months ago
Who Is Eric Ritchson? The Quiet Older Brother of Actor Alan Ritchson
-
 Celebrity3 months ago
Who Is Ramtin Abdo? The Quiet Life of Kate Scott’s Ex-Husband
-

 Celebrity3 months ago
Ellen Heidingsfelder: The Full Story of Cooper Manning’s Wife
-

 Celebrity3 months ago
Thierry Bordelais: The Quiet Husband of Karla Homolka
-

 Celebrity3 months ago
Who Is Valerie Guiliani? Everything to Know About T. J. McConnell’s Wife
-

 Celebrity2 months ago
Crackstube Explained: What It Is, Is It Safe, and Better Options
-

 Technology2 months ago
What Is Upcvee6s5ku? A Simple Guide to This Mystery Code